用Flask和D3.js构建交互式图表
ead>多年来,数据分析对各行业的影响越来越大,因为它已经成为公司决策的关键。数据分析技术可以揭示趋势、模式和指标,提供洞察力和优化。这就是为什么开发人员必须了解如何构建能够轻松实现数据可视化的程序。
在这篇文章中,我们将使用Flask和D3.js来创建一个简单的、交互式的数据仪表板,以了解与假设的客户流失率有关的一些因素。
Flask是一个Python网络框架,提供工具、库和技术来构建网络应用。D3.js是一个JavaScript库,它使用数据操作DOM元素来渲染视觉组件。
项目设置和环境
创建一个隔离的本地环境,指定只适用于这个项目的各种软件包和安装的版本,以防止全局安装和软件包碰撞,这是非常重要的。
我们将从创建一个虚拟的Python环境开始。像这样使用 pip 安装 virtualenv 包。
``` pip install virtualenv
```
导航到项目根目录并创建虚拟环境。
``` virtualenv flask
```
在我们安装包之前,虚拟环境必须被激活。在项目根目录下,执行。
``` source flask/bin/activate
```
接下来,我们安装这个项目所需的包。这可以通过 pip 安装所有的包,或者通过在项目的 GitHub 仓库中找到的requirements.txt文件来完成。
``` pip install -r requirements.txt
```
在成功安装了所需的Python包后,我们转而设置项目的文件结构和所需文件。
.
├── README.md
├── app.py
├── flask
├── static
│ ├── Review.gif
│ ├── css
│ ├── data
│ ├── js
│ └── logo.jpeg
└── templates
└── index.html
项目工作流程概述
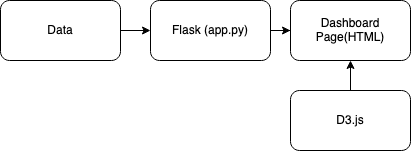
客户流失数据将被提供给Flask应用程序,在那里将用Python进行数据处理操作。Flask应用程序将提供数据仪表板,D3.js将用JavaScript渲染相应的图表。
剖析Flask的网络应用
app.py Python脚本是一个Flask实例,包含入口、路由和终点。Python的Pandas和NumPy库被用来进行数据处理操作。预处理的数据被序列化为JSON格式,以提供给index.html ,分析内容包括合同和任期特征。
合同特征描述了客户与实例公司的合同条款,有三个等级:按月、一年和两年。任期是一个连续的特征,描述了客户在该公司的停留月数。
``` from flask import Flask, jsonify, render_template import pandas as pd import numpy as np
app = Flask(name)
Reading data
data_df = pd.read_csv("static/data/Churn_data.csv") churn_df = data_df[(data_df['Churn']=="Yes").notnull()]
@app.route('/') def index(): return render_template('index.html')
def calculate_percentage(val, total): """Calculates the percentage of a value over a total""" percent = np.round((np.divide(val, total) * 100), 2) return percent
def data_creation(data, percent, class_labels, group=None): for index, item in enumerate(percent): data_instance = {} data_instance['category'] = class_labels[index] data_instance['value'] = item data_instance['group'] = group data.append(data_instance)
@app.route('/get_piechart_data') def get_piechart_data(): contract_labels = ['Month-to-month', 'One year', 'Two year'] _ = churn_df.groupby('Contract').size().values class_percent = calculate_percentage(, np.sum()) #Getting the value counts and total
piechart_data= [] data_creation(piechart_data, class_percent, contract_labels) return jsonify(piechart_data)
@app.route('/get_barchart_data') def get_barchart_data(): tenure_labels = ['0-9', '10-19', '20-29', '30-39', '40-49', '50-59', '60-69', '70-79'] churn_df['tenure_group'] = pd.cut(churn_df.tenure, range(0, 81, 10), labels=tenure_labels) select_df = churn_df[['tenure_group','Contract']] contract_month = select_df[select_df['Contract']=='Month-to-month'] contract_one = select_df[select_df['Contract']=='One year'] contract_two = select_df[select_df['Contract']=='Two year'] _ = contract_month.groupby('tenure_group').size().values mon_percent = calculate_percentage(, np.sum()) _ = contract_one.groupby('tenure_group').size().values one_percent = calculate_percentage(, np.sum()) _ = contract_two.groupby('tenure_group').size().values two_percent = calculate_percentage(, np.sum()) _ = select_df.groupby('tenure_group').size().values all_percent = calculate_percentage(, np.sum())
barchart_data = [] data_creation(barchart_data,all_percent, tenure_labels, "All") data_creation(barchart_data,mon_percent, tenure_labels, "Month-to-month") data_creation(barchart_data,one_percent, tenure_labels, "One year") data_creation(barchart_data,two_percent, tenure_labels, "Two year") return jsonify(barchart_data)
if name == 'main': app.run(debug=True)
```
该入口点有一个index.html 模板文件,由数据仪表板布局组成。index.html 模板由两个容器组成:编写部分和可视化部分。
模板文件包含了脚本文件的访问点和一个CDN,将D3.js与CSS样式表styles.css 一起链接到项目中。脚本包括pieChart.js 、barChart.js 、updateBarChart.js 、和index.js ,它们做了以下工作。
- 渲染饼状图和默认的柱状图
- 根据饼图的选择来更新条形图
- 包括运行图表功能的主脚本,以便在仪表板上渲染。
index.html 模板还通过路由URL获取JSON响应数据,有两个变量:pieChartDataUrl 和barChartDataUrl 。
```
<!DOCTYPE html>
Data Dashboard
Project: Interactive charts for frontend data visualization using flask and D3js
Author: Aboze Brain John
Bio: Aboze Brain John is a Technology Business Analyst. He has experience in Data Science and Analytics, Software Engineering, Product Research, and Technical Writing.
Project Overview: The project is focused on the analysis of churned customers. This analysis is achieved using Python's Flask library to serve the data and Javascript D3.js library to visualize the analysis. The use case is the Telco Customer Churn found on Kaggle here
The code can be found on Github here
The article can be found on Logrocket blog here
}})
```
JavaScript脚本利用函数式编程范式,用各种函数来创建在index.js 中执行的组件。index.js 文件使用承诺来处理异步操作,并表示最终完成(或失败)和结果值。
``` const urls = [pieChartDataUrl, barChartDataUrl];
Promise.all(urls.map(url => d3.json(url))).then(run);
function run(dataset) { d3PieChart(dataset[0], dataset[1]); d3BarChart(dataset[1]); };
```
创建饼状图和柱状图的函数
接下来,我们有两个函数,分别在pieChart.js 和barChart.js 静态文件中创建d3PieChart 和d3BarChart 。我们将利用SVG元素,因为它们提供不同的形状,并提供更多的灵活性和力量。
d3PieChart 函数接受两个参数:饼图数据和数据集,以便在选择饼图的一个片断时更新条形图。pieChart.js 文件包含以下内容。
``` function d3PieChart(dataset, datasetBarChart){ // Set up SVG dimensions and properties const margin = {top:20, right:20, bottom:20, left:20}; const width = 350 - margin.left - margin.right, height = 350 - margin.top - margin.bottom, outerRadius = Math.min(width, height) / 2, innerRadius = outerRadius * .5, color = d3.scaleOrdinal(d3.schemeAccent); //color scheme
// Selecting the div with id pieChart on the index.html template file
const visualization = d3.select('#pieChart')
.append("svg") //Injecting an SVG element
.data([dataset]) //Binding the pie chart data
.attr("width", width)
.attr("height", height)
.append("g") //Grouping the various SVG components
.attr("transform", "translate(" + outerRadius + "," + outerRadius + ")"); //Piechart tranformation and transition upon page loading
const data = d3.pie() //Creating the data object that will develop the various segment of the pie chart. .sort(null) .value(function(d){return d.value;})(dataset); // Retrieve the pie chart data values from our Flask app, the pie chart where tied to a 'value' key of a JSON object.
// Generate an arc generator that produces the circular chart (outer circle)
const arc = d3.arc()
.outerRadius(outerRadius)
.innerRadius(0);
// Generate an arc generator that produces the circular chart (inner circle)
const innerArc = d3.arc() .innerRadius(innerRadius) .outerRadius(outerRadius);
// Create pie chart slices based on the data object created
const arcs = visualization.selectAll("g.slice")
.data(data)
.enter() // creates the initial join of data to elements
.append("svg:g")
.attr("class", "slice")
.on("click", click);
arcs.append("svg:path") // create path element .attr("fill", function(d, i) { return color(i); } ) //Add color to slice .attr("d", arc) // creates actual SVG path with associated data and the arc drawing function .append("svg:title") // Add title to each piechart slice .text(function(d) { return d.data.category + ": " + d.data.value+"%"; });
d3.selectAll("g.slice") // select slices in the group SVG element (pirchart) .selectAll("path") .transition() //Set piechart transition on loading .duration(200) .delay(5) .attr("d", innerArc);
arcs.filter(function(d) { return d.endAngle - d.startAngle > .1; }) //Define slice labels at certain angles .append("svg:text") //Insert text area in SVG .attr("dy", "0.20em") //shift along the y-axis on the position of text content .attr("text-anchor", "middle") //Position slice labels .attr("transform", function(d) { return "translate(" + innerArc.centroid(d) + ")"; }) //Positioning upon transition and transform .text(function(d) { return d.data.category; }); // Append category name on slices
visualization.append("svg:text") //Append the title of chart in the middle of the pie chart .attr("dy", ".20em") .attr("text-anchor", "middle") .text("churned customers") .attr("class","title");
// Function to update barchart when a piechart slice is clicked function click(d, i) { updateBarChart(d.data.category, color(i), datasetBarChart); } }
```
d3BarChart 函数定义了默认组,当页面加载时,没有选择特定的合同类,就会被可视化。默认组是流失客户的任期分布。
d3BarChart 只接受一个参数:所服务的条形图数据。barChart.js 包含以下内容。
``` //Set up SVG dimensions and properties const margin = {top: 20, right: 10, bottom: 20, left: 20}, width = 350 - margin.left - margin.right, height = 350 - margin.top - margin.bottom, barPadding = 5, graph_misc = {ylabel: 4, xlabelH : 5, title:9};
// Setting the default group const group = "All";
// Function to get the percentage values for a specific selected group from the whole dataset. function get_percentage(group, datasetBarChart){ const _ = []; for (instance in datasetBarChart){ if (datasetBarChart[instance].group==group){ .push(datasetBarChart[instance]) } } return ; };
function d3BarChart(datasetBarChart){ defaultBarChart = get_percentage(group, datasetBarChart);
const xScale = d3.scaleLinear() // Barchart X axis scale .domain([0, defaultBarChart.length]) // Scale range from 0 to the length of data object .range([0, width]);
const yScale = d3.scaleLinear() // Barchart y axis scale .domain([0, d3.max(defaultBarChart, function(d) { return d.value; })]) //Scale range from 0 to the maximum value of the default bar chart data .range([height, 0]);
// // Selecting the div with id barChart on the index.html template file const bar = d3.select('#barChart') .append('svg') .attr('width', width + margin.left + margin.right) .attr('height', height + margin.top + margin.bottom) .attr('id', 'barChartPlot');
//Adding barchart title
bar.append('text')
.attr('x', (width + margin.left + margin.right)/2)
.attr('y', graph_misc.title)
.attr('class','title')
.attr('text-anchor', 'middle')
.text('Tenure group for churned customers');
const visualization = bar.append('g') .attr("transform", "translate(" + margin.left + "," + (margin.top + graph_misc.ylabel) + ")");
visualization.selectAll("rect")
.data(defaultBarChart)
.enter()
.append("rect")
.attr("x", function(d, i) {
return xScale(i);
})
.attr("width", width / defaultBarChart.length - barPadding)
.attr("y", function(d) {
return yScale(d.value);
})
.attr("height", function(d) {
return height-yScale(d.value);
})
.attr("fill", "#757077");
//Adding barchart labels visualization.selectAll('text') .data(defaultBarChart) .enter() .append("text") .text(function(d) { return d.value+"%"; }) .attr("text-anchor", "middle")
   .attr("x", function(d, i) {
           return (i * (width / defaultBarChart.length)) + ((width / defaultBarChart.length - barPadding) / 2);
   })
   .attr("y", function(d) {
           return (yScale(d.value) - graph_misc.ylabel); //Setting the Y axis to represent the value in the served JSON data
   })
   .attr("class", "yAxis");
const xLabels = bar .append("g") .attr("transform", "translate(" + margin.left + "," + (margin.top + height + graph_misc.xlabelH) + ")");
xLabels.selectAll("text.xAxis")
.data(defaultBarChart)
.enter()
.append("text")
.text(function(d) { return d.category;})
.attr("text-anchor", "middle")
.attr("x", function(d, i) {
return (i * (width / defaultBarChart.length)) + ((width / defaultBarChart.length - barPadding) / 2);
})
.attr("y", 15)
.attr("class", "xAxis");
}
```
使图表互动
我们已经成功地创建了默认的条形图,但是为了使我们的项目具有互动性,我们将在选择饼图片时用新的数值更新条形图。
updateBarChart.js 脚本将启用这一功能。它接受三个参数:在饼图上选择的组,饼图片的颜色,以及更新的条形图数据。
``` function updateBarChart(group, color, datasetBarChart){ const currentBarChart = get_percentage(group, datasetBarChart);
//Defining chart scale, same as the default bar chart const xScale = d3.scaleLinear() .domain([0, currentBarChart.length]) .range([0, width]);
const yScale = d3.scaleLinear() .domain([0, d3.max(currentBarChart, function(d) { return d.value; })]) .range([height,0]);
const bar = d3.select('#barChart svg'); //Selecting the div containing bar chart ID and creating an SVG element
// Add title to Barchart
bar.selectAll("text.title")
.attr("x", (width + margin.left + margin.right)/2)
.attr("y", graph_misc.title)
.attr("class","title")
.attr("text-anchor", "middle")
.text("Tenure group for churned customers "+group);
const visualization = d3.select('barChartPlot') .datum(currentBarChart); //binding data to multiple SVG elements
visualization.selectAll('rect') .data(currentBarChart) .transition() .duration(750) .attr('x', (width + margin.left + margin.right)/2) .attr('y', graph_misc.title) .attr('class', 'title') .attr('text-anchor', 'middle') .text('Tenure group for churned customers '+group);
const plot = d3.select('#barChartPlot') .datum(currentBarChart); //binding data to multiple SVG elements
plot.selectAll('rect') .data(currentBarChart) .transition() //Setting bar chart change transition .duration(800) .attr('x', function(d,i){ return xScale(i); }) .attr('width', width/currentBarChart.length - barPadding) .attr('y', function(d){ return yScale(d.value) }) .attr("height", function(d) { return height-yScale(d.value); }) .attr("fill", color);
plot.selectAll("text.yAxis") .data(currentBarChart) .transition() .duration(750) .attr("text-anchor", "middle") .attr("x", function(d, i) { return (i * (width / currentBarChart.length)) + ((width / currentBarChart.length - barPadding) / 2);}) .attr("y", function(d) { return yScale(d.value) - graph_misc.ylabel;}) .text(function(d) { return d.value+'%';}) .attr("class", "yAxis"); };
```
添加样式
最后,让我们为我们的HTML模板添加一些样式。样式表应该链接到index.html 文件,并在styles.css 静态文件中包含以下样式。
``` / Reset default browser settings /
/ Box sizing rules / , ::before, *::after { box-sizing: border-box; }
/ Remove default padding and margin / * { padding: 0; margin: 0; }
/ Set core body defaults / body { position: fixed; display: flex; background: #fdfdfd; scroll-behavior: smooth; text-rendering: optimizeSpeed; font-family: "Roboto Mono", monospace; font-weight: bold; -webkit-font-smoothing: antialiased; overflow-x: hidden; }
/ Make images easier to work with / img { max-width: 100%; display: block; }
.about { margin: 10% 2%; width: 40%; text-align: justify;
} h1 { text-decoration: underline; margin: 0.5em 0em; }
p, h2, h6 { margin: 0.7em 0em; }
a { text-decoration: none; }
.visualization { display: flex; align-items: center; flex-direction: column; width:60%; }
pieChart {
margin-top: 4em; font-size: 12px; }
barChart {
font-size: 9px; margin-top: 4em; }
pieChart .title, #barChart .title{
font-weight: bold; }
.slice {
font-size: 8px;
font-family: "Roboto Mono", monospace;
fill: white;
font-weight: bold;
cursor: pointer;
}
```
交互式数据仪表板已经成功建立最后,我们将在终端上运行我们的Flask应用,如下所示。
``` python run.py
```
网络应用将被托管在我们的localhost:5000上,可以通过任何浏览器访问。
总结
在这篇文章中,我们介绍了如何使用Python的Flask的服务和预处理的数据来建立一个交互式的图表仪表盘。我们操作了DOM元素,在网页上用Javascript D3.js渲染可视化效果。你可以使用这种技术来渲染柱状图或饼状图,并在你的下一个项目中轻松纳入数据可视化。
用Flask和D3.js构建交互式图表》一文出现在LogRocket博客上。
- 在C 中把字符串转换为整数的两种简单方法
- 如何在Flutter中实现任何UI
- Gatsby v4的新内容
- 创建一个Puppeteer微服务以部署到Google Cloud Functions
- 在Blazor中测试。一个完整的教程
- 在React中使用Plotly来构建动态图表
- 分页、加载更多按钮和无限滚动的指南
- 用新的Firebase v9.x Web SDK重构一个React应用
- 在使用地理定位API时,你需要知道什么?
- 在PostgreSQL v14中,JSON有什么新功能?
- 使用React的函数式编程的基础知识
- 使用Dart FFI访问Flutter中的本地库
- 使用视频播放器插件在Flutter中处理视频
- 改进过度约束的Rust库API
- 用Svelte建立一个PWA
- 用Flask和D3.js构建交互式图表
- 在Go中使用JSON。带例子的指南
- 一篇文章入门Unix中的AWK命令!
- C 哈希
- Dotfiles - 什么是Dotfile以及如何在Mac和Linux中创建它