聲網許振明:RTC 場景 UHD 視頻應用和探索
大家好,我是聲網的視頻工程師許振明,今天跟大家主要介紹一下聲網在 RTC 場景 UHD 視頻的應用和探索。主要基於聲網 HFR 和 VDR 兩個系統來展開分享。
**隨着 RTC 技術的發展和應用,越來越多的場景都需要接入 RTC 的能力。**尤其是隨着編碼技術、設備能力的迭代,應用場景對視頻分辨率、幀率、色彩還原提出了更高的要求。
聲網 RTC 在 UHD 視頻 4K60FPS、HDR 方面做了一些工程實踐和探索,主要應用在教育雙師、高端會議、體育運動等場景。下面我們介紹下聲網 UHD 視頻的技術支撐,探討下 4K60FPS、 HDR 產品化上遇到卡頓、設備適配相關的典型問題。
1、UHD
UHD 是 Ultra High Definition 的縮寫,也就是超高清的意思。超高清的標準一般是當分辨率達到 4K 或以上,也就是 3840x2160 分辨率及以上,與之對應的概念是 FULL HD、HD。
UHD 視頻的概念出現的很早,傳統的視頻領域、家庭電視、傳統的視頻直播等都有所應用。UHD 視頻有 5 大要素:
- 超高清:4K、8K
- 高幀率:渲染
- 高動態範圍:HDR
- 寬色域:WCG
- 色深:10bit、12bit
對於 RTE UHD 視頻而言,即繼承了傳統 UHD 視頻的幾大要素,也做了一些擴充:
- 超高清:4K、8K
- 高幀率:採集、渲染
- 高動態範圍:HDR
- 寬色域:WCG
- 色深:10bit、12bit
- 色彩範圍:Limit、Full 低延時
RTC 區別於傳統直播很重要的一個優勢,便是低延時,不能因為分辨率的提升影響延時的效果。
2、聲網 UHD 視頻
在聲網的業務場景中,主要通過 HFR(high frame rate)、VDR(variable dynamic range) 2 套系統實現 UHD 視頻的支持。
HFR 主要涉及的是超高清、高幀率和低延時;VDR 包含了高動態範圍、HDR 到 SDR 的轉換、寬色域、色深、色彩範圍。
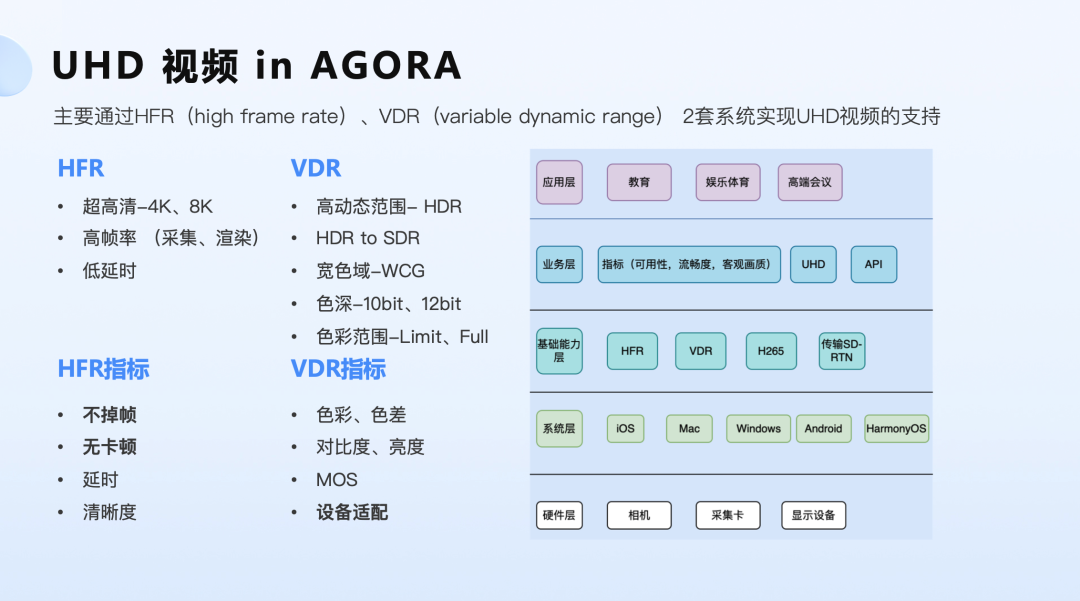
如上圖右側所示,我們對 UHD 視頻的能力進行了簡單的分層。
硬件層以相機為例,至少需要能採集 4K60FPS 的相片;顯示設備也需要支持 HDR 的顯示效果;系統層包含所有業務場景中應用的系統。假如系統因版本問題不支持色彩管理或者色域管理,對於 HDR 效果的實現會增加難度。
再往上是聲網提供的基礎能力層。比如我們前面提到的 HFR、VDR,以及新一代編碼算法 H.265、傳輸 SD-RTN;業務層包含各種指標、UHD 和基礎能力層為業務提供的 API。
最頂部是應用層。聲網作為一家 ToB 的公司,針對不同行業的客户會提供不同的場景應用能力,用業務層對應並支撐應用層。
對於 HFR 我們制定了幾個指標:
- 不掉幀
- 無卡頓
- 延時
- 清晰度
對於 VDR 的指標則主要是針對於色彩相關,包括:
- 色彩、色差
- 對比度、亮度
- MOS
- 設備適配
下面我們針對 HFR 和 VDR 分別進行展開介紹。
3、HFR
在一些常見的卡頓場景中,雖然帶寬足夠,但因為幀率較低所以造成了主觀上嚴重的卡頓。除幀率外,對於卡頓的另一個評價標準是均勻度。如在 50 幀的視頻中,每兩幀的間隔是 20 毫秒,唯獨第 47 幀和 48 幀間隔了 200 毫秒,這種不均勻的情況也會導致明顯的卡頓。
除幀率外,對於卡頓的另一個評價標準是均勻度。如在 50 幀的視頻中,每兩幀的間隔是 20 毫秒,唯獨第 47 幀和 48 幀間隔了 200 毫秒,這種不均勻的情況也會導致明顯的卡頓。
在 RTC 場景中,影響卡頓的因素主要有三個:
- 網絡
- PIPELINE
- 性能
網絡傳輸中的丟包或抖動,會導致卡頓;視頻 PIPELINE 中掉幀、重複幀、吞幀以及抖動造成的不均勻,也會使得幀率或均勻度出現問題,從而導致卡頓;性能導致的卡頓主要是 CPU 或者 GPU 負載較高時,出現耗時較高的情況。
通過我們的測試,當 CPU 跑到 85% 以上時,會明顯影響引擎的工作,進而出現卡頓的風險。所以建議把 CPU 的佔有率保持在 70% 以下,從而保證較好的處理性能。
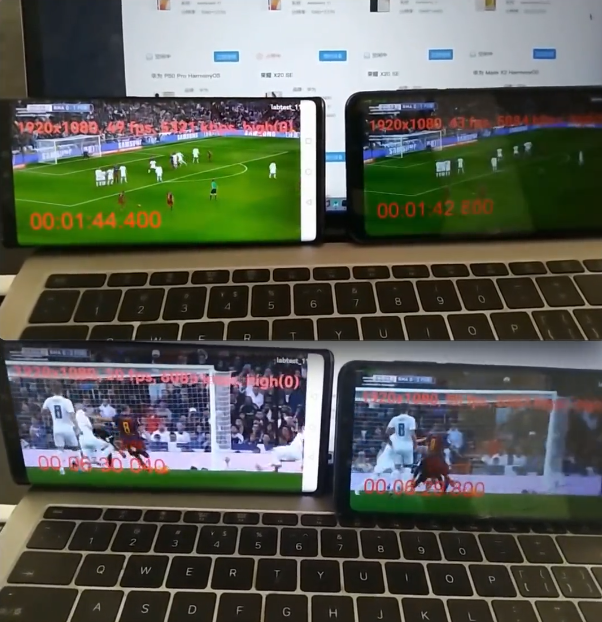
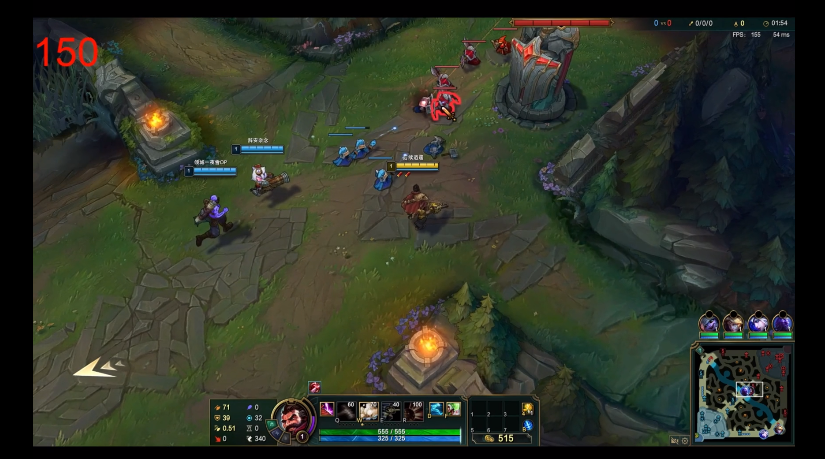
現階段常見的RTC 場景是 720FPS15、720FPS30 或者 1080FPS50,4K60FPS 因為對 SDK 負載的壓力以及各個環節的處理精度提出了更高的要求,比如帶寬、線程調度、內存管理、採集精度、上屏幀率等,目前一般只應用於某些專業的場景。
另外,條件要求越高便越容易出現問題,越靠近最終效果主觀越難判斷。60FPS 和 10FPS 的區別人眼是可以分辨的,但 56FPS 和 57FPS、60FPS 的區別,在人眼看來幾乎沒有不同,因此需要藉助專業的量化工具來進行測量。
量化的方法一般有兩種,第一種是 perfdog 方法,通過統計屏幕 Display 新一幀後真實刷新的 FPS 和幀耗時。
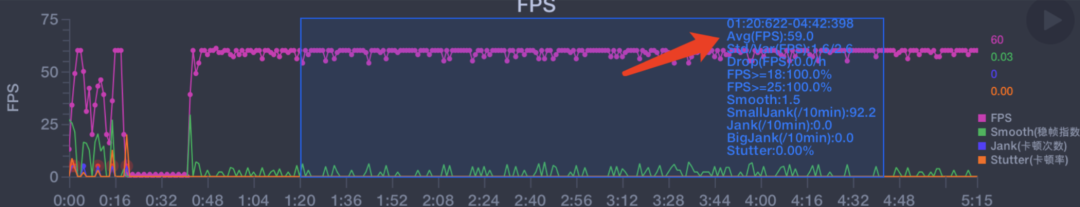
這種方法的優點是可以看到整個業務的真實幀率,並且比較貼近用户的主觀感受。缺點是無法檢測出當視頻中出現的重複幀。
舉個例子。當 60 幀的視頻中第 56 幀和 57 幀是重複幀時,人眼明顯可以看出卡頓,但 perfdog 仍然會顯示 60 幀的刷新,檢測不到出現的重複幀。對此,聲網進行了方案的優化,基於相鄰幀的相似度和間隔提取,來解決重幀檢測不到的問題。
這種方法主要通過對相鄰的兩幀進行相似度的計算,當相似度為 100%,也就是完全重合的時候,就可以判斷這兩幀為重幀。另外要考慮的是兩幀提取的時間和間隔,如果在 60 幀的情況下提取的時間間隔是 30 毫秒,是與我們的預期不相符的,我們便可以認定這個視頻不太符合正常的邏輯。
從一些視頻相鄰的兩幀,可以看出有一定的變化幅度,但幅度很小。因為人眼的觀察能力存在差異,進行主觀的評測很可能會遺漏或出現偏差,存在不確定性,因此通過量化方法可以避免不確定性的出現,保證 4K60幀的視頻真的具有 60 幀。
前文我們講了如何評測 4K60幀的視頻質量,下面我們談一下針對 4K60幀的卡頓都涉及哪些問題,又該如何優化。
首先和大家介紹一個基於渲染來優化卡頓的方案 —— 基於 vsync 的渲染。
vsync 是垂直同步( Vertical Synchronization )的簡稱。基本的思路是將 FPS 和顯示器的刷新率進行同步。vsync 在設備中一般是一個硬件信號,根據不同的平台封裝不同的系統機制。
針對 60 幀的視頻來説,每一幀都控制在 16.6 毫秒內刷新,就能保證在一個 vsync 週期內,保證不會產生 Jank。但很多場景中不存在理想的情況,如下圖所示:
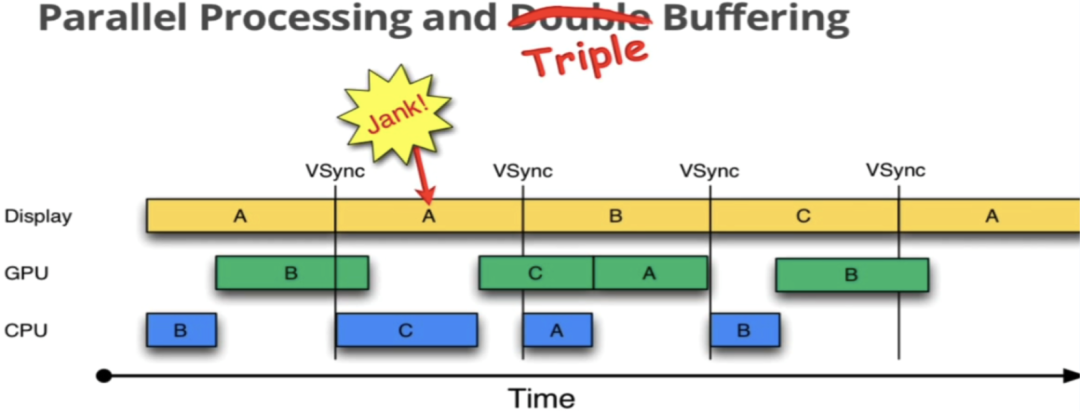
本來 Jank 要顯示 B,但因為 A 還在顯示,導致了 B 的延時,從而產生了卡頓。B 會延時的原因是在中間處理時 B 的耗時稍微有些長,產生了一些抖動。面對這種情況,聲網採用了類似於 Double Buffering 或者 Triple Buffering 的機制來處理偶爾出現的抖動。
另外,採集的精度也會影響卡頓的情況。例如在屏幕採集時,假設我們模擬了一個 16.6 毫秒的事件驅動來採集 vsync,但很多情況下因為時延的問題採集不到比較高的精度,效果如下圖所示:
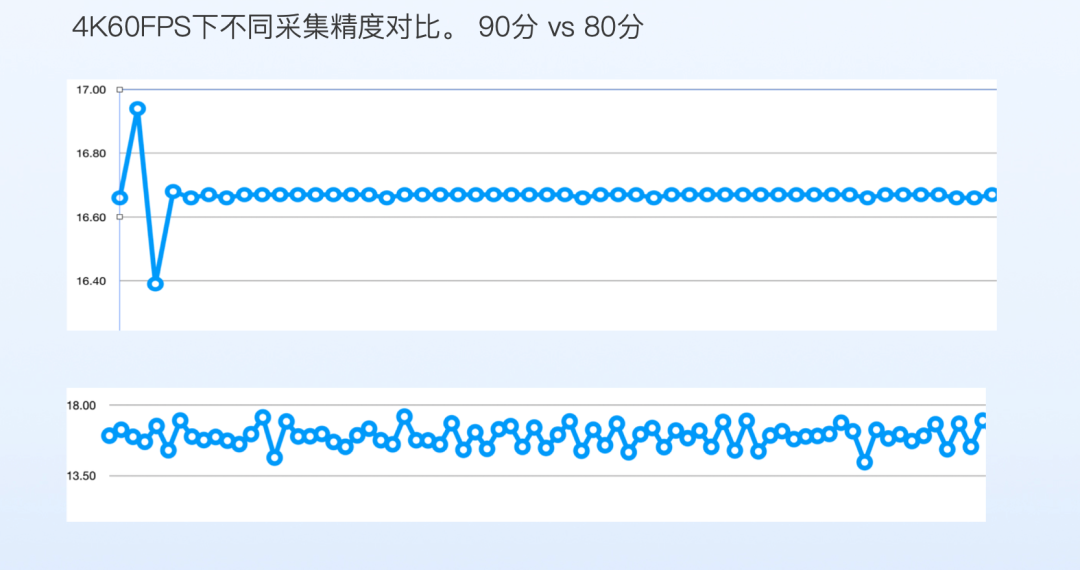
圖中下側折線圖展示的是目前市面上以及部分開源 SDK 的能力狀態,基本會在 14 毫秒到 18 毫秒間的波動。這種情況下 60 幀的採集是不夠的。因此聲網在此基礎上進行了優化,效果如圖中上側折線圖所示,基本能夠收斂在 16.6 毫秒上下,誤差 1 毫秒左右,效果基本可以接近 vsync。
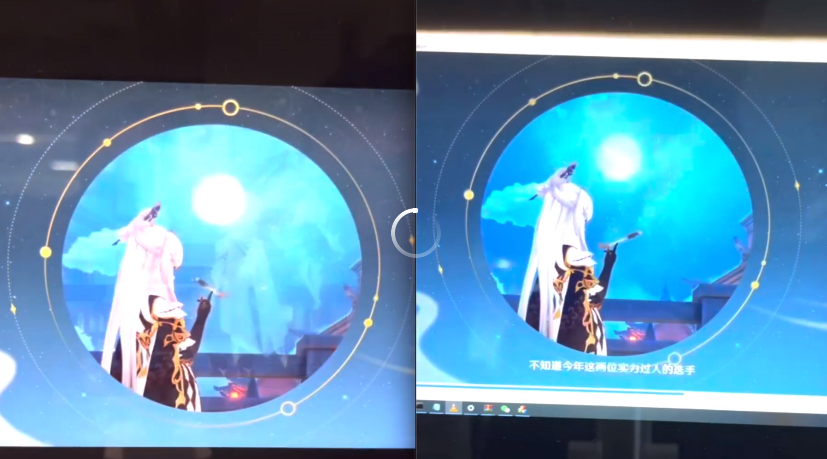
上圖是一個主觀對比的簡單示例。左側為優化前,右側為優化後。大家可以觀察下畫面外圍的圈在轉動時,左側的頓挫感明顯大於右側。
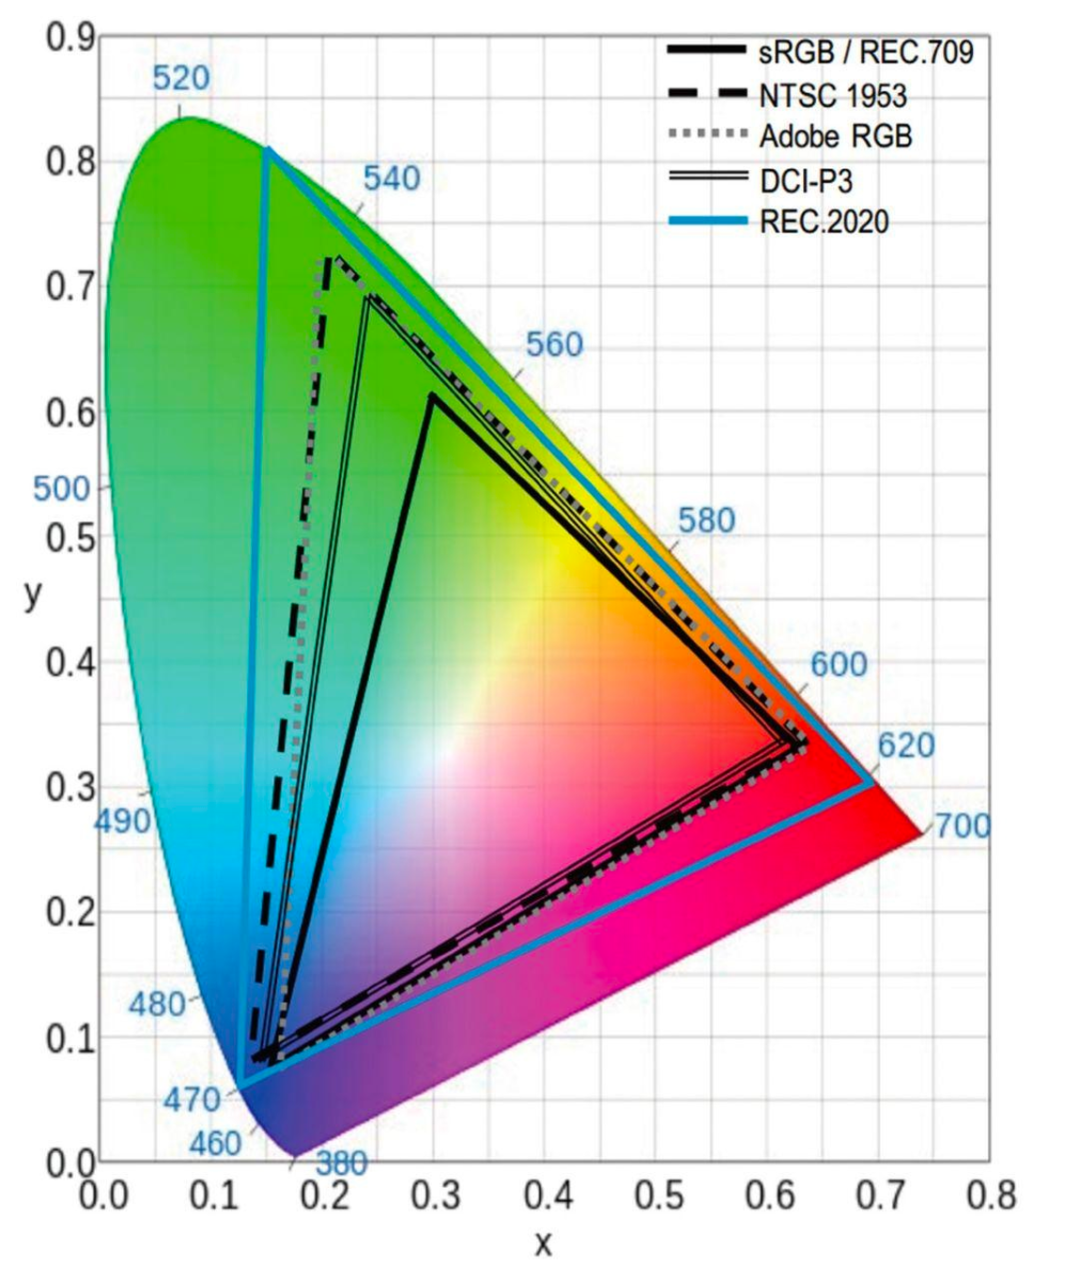
在 VDR 中有一個很重要的概念叫色彩空間,包含了 Color range 和 Color space。其中 Color range 主要是色彩範圍,分為 full range 和 video range,取值範圍 [0,255], [16,235]。
Color space 指的是色域。RGB 是一個相對色彩空間,xyz 是絕對的色彩空間對應自然界的顏色,RGB需要通過color space(bt601,bt709,bt2020,srgb,dcp13) 映射到絕對色彩空間。同一個 RGB 值,不同的色域定義下,對應到不同的自然界顏色。
如下圖所示,從 bt601 到 bt709 再到 bt2020,色域的範圍是越來越廣的。所以如果是同一個 RGB 值,如果色域的定義不一樣,那麼對應到圖中的落點也是不同的。
色差是 HDR 裏面非常重要的一個概念。一個 yuv 用某個矩陣從 RGB 得到,轉換成 RGB 也要用同樣的逆矩陣,才能得到正確的 RGB 和顏色。
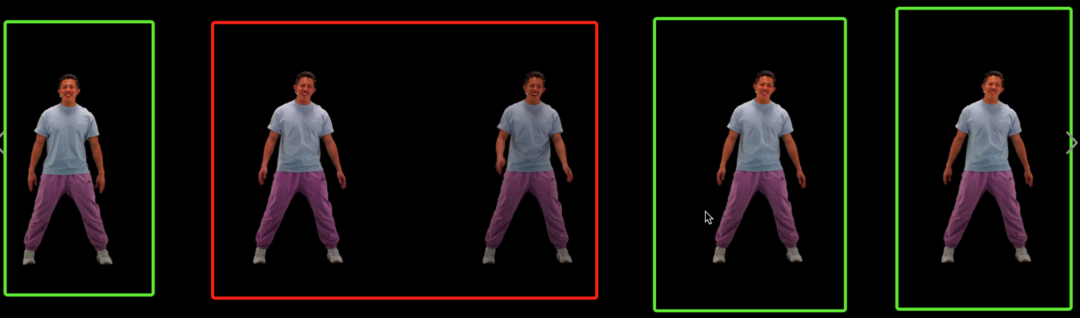
如上圖所示,最左側第一個人像為原圖,第 2、第 3 個人像是用了錯誤的逆矩陣進行轉換,導致人臉、衣服的亮度和色彩都發生了較為明顯的變化。第 4、第 5 個人像是用來相同的逆矩陣,所以轉換出來的效果和原圖更為接近。
另外在 VDR 中,HDR 在亮度、色彩色域、對比度上比 SDR 有優勢。如下圖所示:
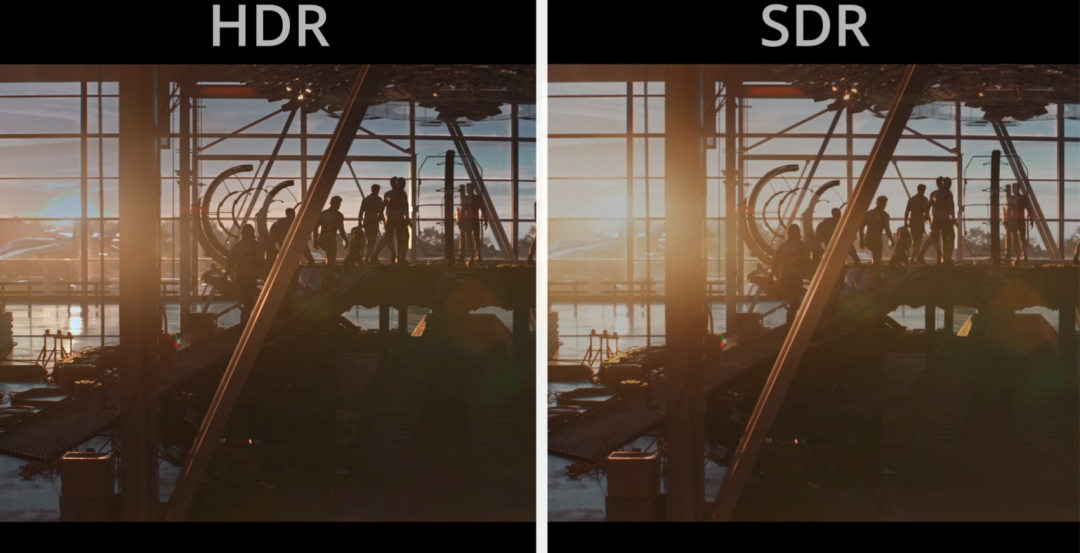
我們可以看幾個細節點。首先看天空的雲彩雲層以及藍天的顏色,HDR 的表現力以及細節展示是比 SDR 更豐富的。另外可以看一下夕陽的部分,光照照到地面上的一些細節表現,HRD 明顯比 SDR 要更清晰,細節展示更多。
目前越來越多的設備開始支持 HDR 顯示,據不完全統計大致有幾萬種不同的設備,但不同的設備對 HDR 的支持程度是不一樣的。支持 HDR 的設備屏幕亮度從 500nit 到 2000nit,並且還有一部分支持 P3 色域、一部分支持 BT2020。
HDR 視頻要在該設備上達到好的效果需要 tone mapping。下圖是同一設備中不同 tone mapping 的對比:
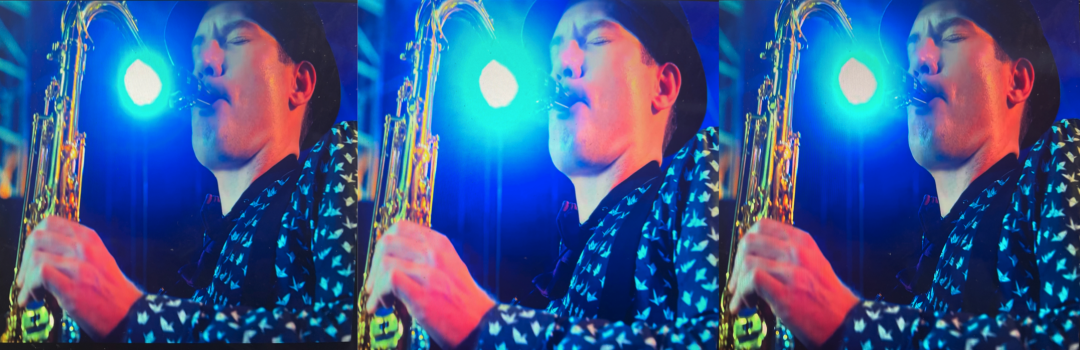
這三張圖來自同一個源,但在飽和度、畫面細節、亮度處理、平滑處理等維度均有差異化的表現。人眼判斷下,可以看出第一張圖的算法處理效果是相對較好的。
另外,很多設備並不支持 HDR 顯示,並且 SDR 屏幕的亮度和色域達不到 HDR 的要求,如果不考慮設備的支持強制的把 HDR 視頻顯示在 SDR 的屏幕上,會產生比優化前更差甚至不可接受的效果。
為了讓儘可能多的用户體驗到 HDR,我們可以藉助 HDR2SDR,把 HDR 的視頻通過算法降級到 SDR,然後再在 SDR 的屏幕上做顯示。
這個功能在 RTC 場景中有着很實際的應用。當一個頻道內多人互動時,如果有一個人的設備不支持 HDR,傳統的邏輯是所有人都需要退回到 SDR 發送。而藉助 HDR2SDR 功能就可以讓大家都體驗到 HDR 的效果。
大家關注的另一點,是如何判斷從 HDR 轉換到 SDR 後的效果是否夠好。對於好壞的判斷需要一個參照物,如果效果和 HDR 很接近並且又能正常顯示,我認為就是一個相對較好的效果。
下方的 4 張圖是同一場景中不同的畫面展示效果:
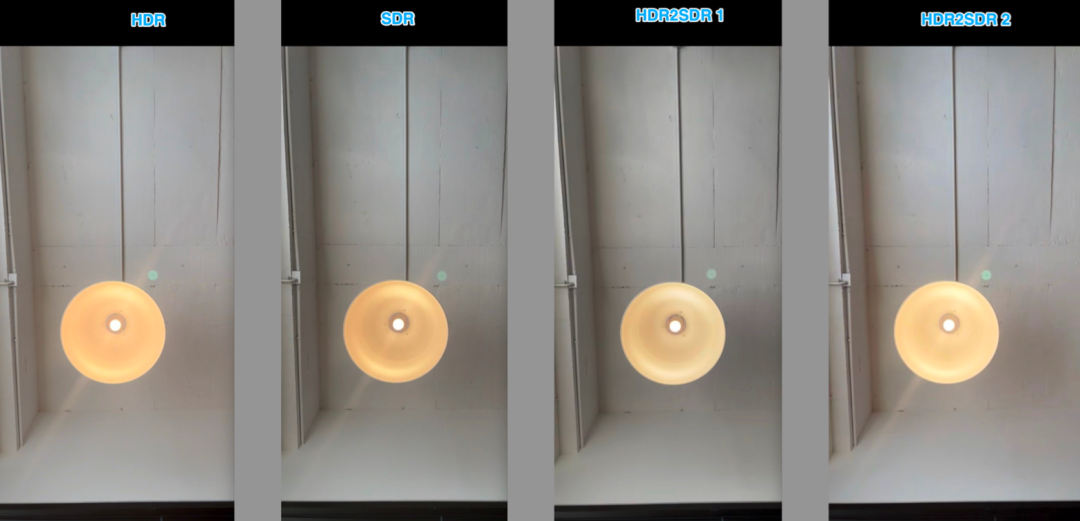
從圖中開一看出,HDR 的在亮度和細節展示方面明顯優於 SDR。第三張圖是 HDR2SDR 的一種算法實現,展示效果有所優化,但細心的朋友可以發現算法消除了燈光的光暈。
第四張圖是 HDR2SDR 的另一種算法,在提升展示效果的同時保留了光暈的細節。我們一般認為第二種算法要優於第一種算法,更接近我們想要的需求和效果。但這類評價都是偏主觀的,還是要看優化後的參照物是什麼,特定情況進行特定的分析。
以上是我本次分享的內容。聲網在 UHD 視頻方面主要是通過高幀率系統和 VDR 系統實現 UHD 視頻的支持。歡迎大家體驗、交流,謝謝。
點擊下方圖片,即可查看完整視頻回顧

- 註冊並試用每月 10000 分鐘免費的聲網視頻SDK,體驗四行代碼、三十分鐘快速構建沉浸式實時互動場景
- 下載體驗聲網相關 SDK & Demo
- 保姆級教程!集成聲網 SDK 實現 iOS 平台音視頻通話和虛擬背景功能
- 在 Flutter 多人視頻中實現虛擬背景、美顏與空間音效
- 基於聲網 Flutter SDK 實現互動直播
- 保姆級教程!基於聲網 Web SDK實現音視頻通話及屏幕共享
- 基於聲網 Flutter SDK 實現多人視頻通話
- 把 ChatGPT 加入 Flutter 開發,會有怎樣的體驗?
- 如何基於開源 demo 在 Web 端實現一個多人數獨遊戲
- 《鵝鴨殺》爆火,一文帶你瞭解如何實現頂流社交遊戲
- 聲網許振明:RTC 場景 UHD 視頻應用和探索
- RTE 領域的發展,為視頻編解碼標準帶來哪些新變化?丨Dev for Dev 專欄
- 人臉關鍵點的應用場景及重難點解析丨Dev for Dev 專欄
- 糾刪碼在實時視頻流中的應用丨Dev for Dev 專欄
- 音頻技術的下一個“熱點”,會出現在哪個領域?丨一期一會 • 音頻工程師專場
- 一片紅的泛娛樂出海,藍色在哪裏?
- 聲網“失聲”的危機
- 百鍊成鋼 —— 聲網實時網絡的自動運維丨Dev for Dev 專欄
- 桌面軟件開發框架大賞
- 基於對象的實時空間音頻渲染丨Dev for Dev 專欄
- 即時通訊場景下安全合規的實踐和經驗
- 基於 Web SDK 實現視頻通話場景 | 聲網 SDK 教程